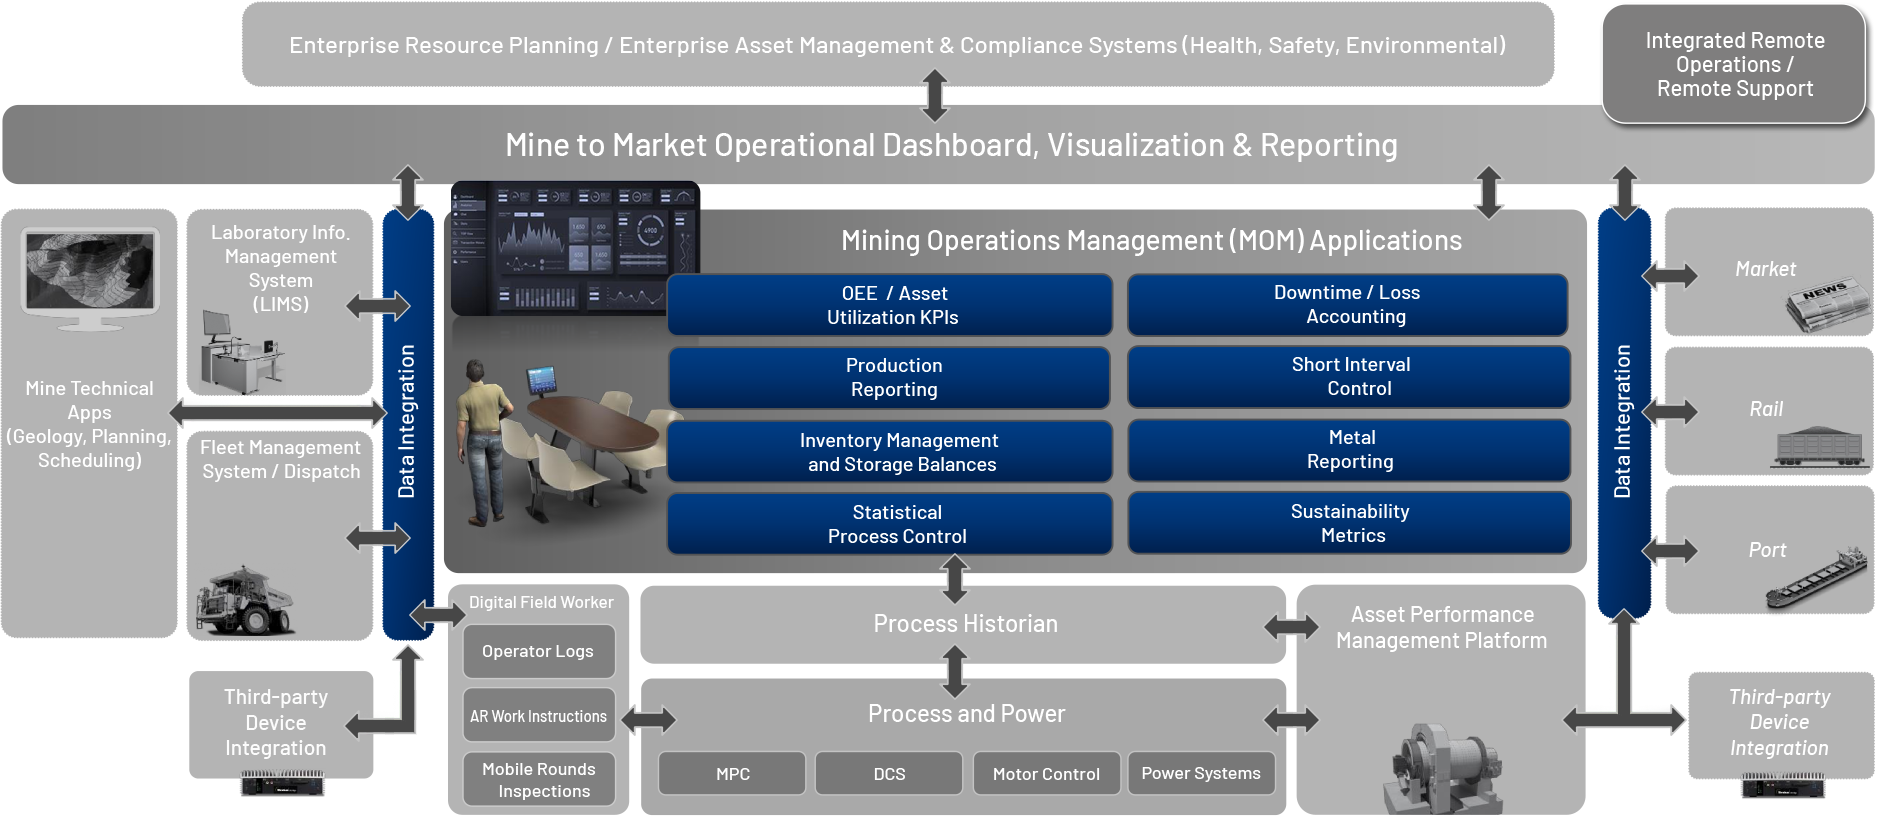
non-chronological data receipts
KPIs allow benchmarking of performance over time and provide clear indication as to which plant areas and equipment are performing well, and which are creating production losses
Processing areas don't all contribute equally to the aggregate: the solution aggregates / proportion time & losses intelligently.


Total Throughput Rate = Performance
Downtime = Availability
Output = Yield
Waste = Recovery Losses
- Indentifies the business impact of planned and unplanned stoppages
- Indentifies the impact and cause of rate losses
- Indentifies systematic causes of failure and loss


Rate losses are caused by both equipment and feed blend factors
Downtime can be attributed to the whole circuit, individual equipment, or components, with contextualized reasons for each element
Automated reporting of actual feed stock blends, throughputs, consumption of reagents and flocculants, and outputs in the context of where they are consumed, produced, recovered or recirculated


Tonnage-weighted blend profile by pit source based on fleet management haul cycles.
Ratio of feed by size distribution, regrind tonnages, and crusher performance
Consumption and recovery of reagents and flocculants
Produced product by grade and size
Shipped product by source stockpile (including blending), consignment ID and wagon
Shipped product by source stockpile (including blending), ship, hatch and pour
Factors which impact or contribute to performance, health, and quality are measured against known boundary thresholds to alert operators when the circuit is not functioning as required. This allows operators to make meaningful changes within the shift to improve orverall productivity.


The total duration of time spent above a torque threshold within each hour can indicate an excess of hard or large rocks in the feed stock. The total duration spent below a minimum torque threshold while the feed rate is above a nominal setpoint over a few hours can indicate excessive gap creep.
If the average reagent dose rate to feed rate ratio is too high over a 4-hour window, then the flotation circuit may be out of balance and underperforming.
If the average hourly flocculant dose rate is continually increasing over a 4-hour window, then there may be excess product going to the thickener indicating a potential recovery loss.
Reports the net balance in stockpiles, stockpile partitions, silos, tanks, and other storage vessels based on metered additions, depletions, and survey adjustments.
Tracks the grade from source to destination, allowing predictions of loadout grade based on source stockpile ratios before the lab results are available. Materials and grades can be tracked by either physical or virtual models.


Feed-stock is reported by tonnage-weighted grade over time intervals, based on the pit block model`s core grade profile
Balance is calculated from upstream weightometers and stacker position, combined with loadout depletions and reclaimer position. The balance is typically corrected for bias on a monthly basis via survey adjustments.
Grade is estimated based on the ratio of source stockpile partitions blended into the loadout bin.
Stack-average grade is based on lab results from upstream sources feeding onto the stockpile and segmented into partitions by the stacker and reclaimer positions and activities.
Aligns sample results with material movements to calculate the constituent quantities of the various elements within the overall ore flow. Recoveries and losses can be calculated separately for each mineral within the ore body.


Block model core grades used to estimate the expected grade of each haul truck movement based on its load location within the mine.
Lab results which become available many hours after the processing operation are retroactively applied to align with the material movement quantities at the time of sampling.
Upstream sampling is tracked to the stockpile partitions based on the stacker position to estimate the stack-average grade profile across the stockpile. Reclaimed depletions deduct the related upstream sample results based on the stockpile stacking/reclaiming methodology.
Recovery losses are identified and flagged to cater for upstream process adjustments.
Application of statistical methods to identify quality exceptions and deviations before reaching out-of-specification limits


Identify when grades are slipping consistently in the same direction for too long.
Indetify when grades are unstable, creating unpredictable product output.

